temperature
Type of resources
Topics
INSPIRE themes
Keywords
Contact for the resource
Provided by
Years
Formats
Representation types
Update frequencies
status
Resolution
-

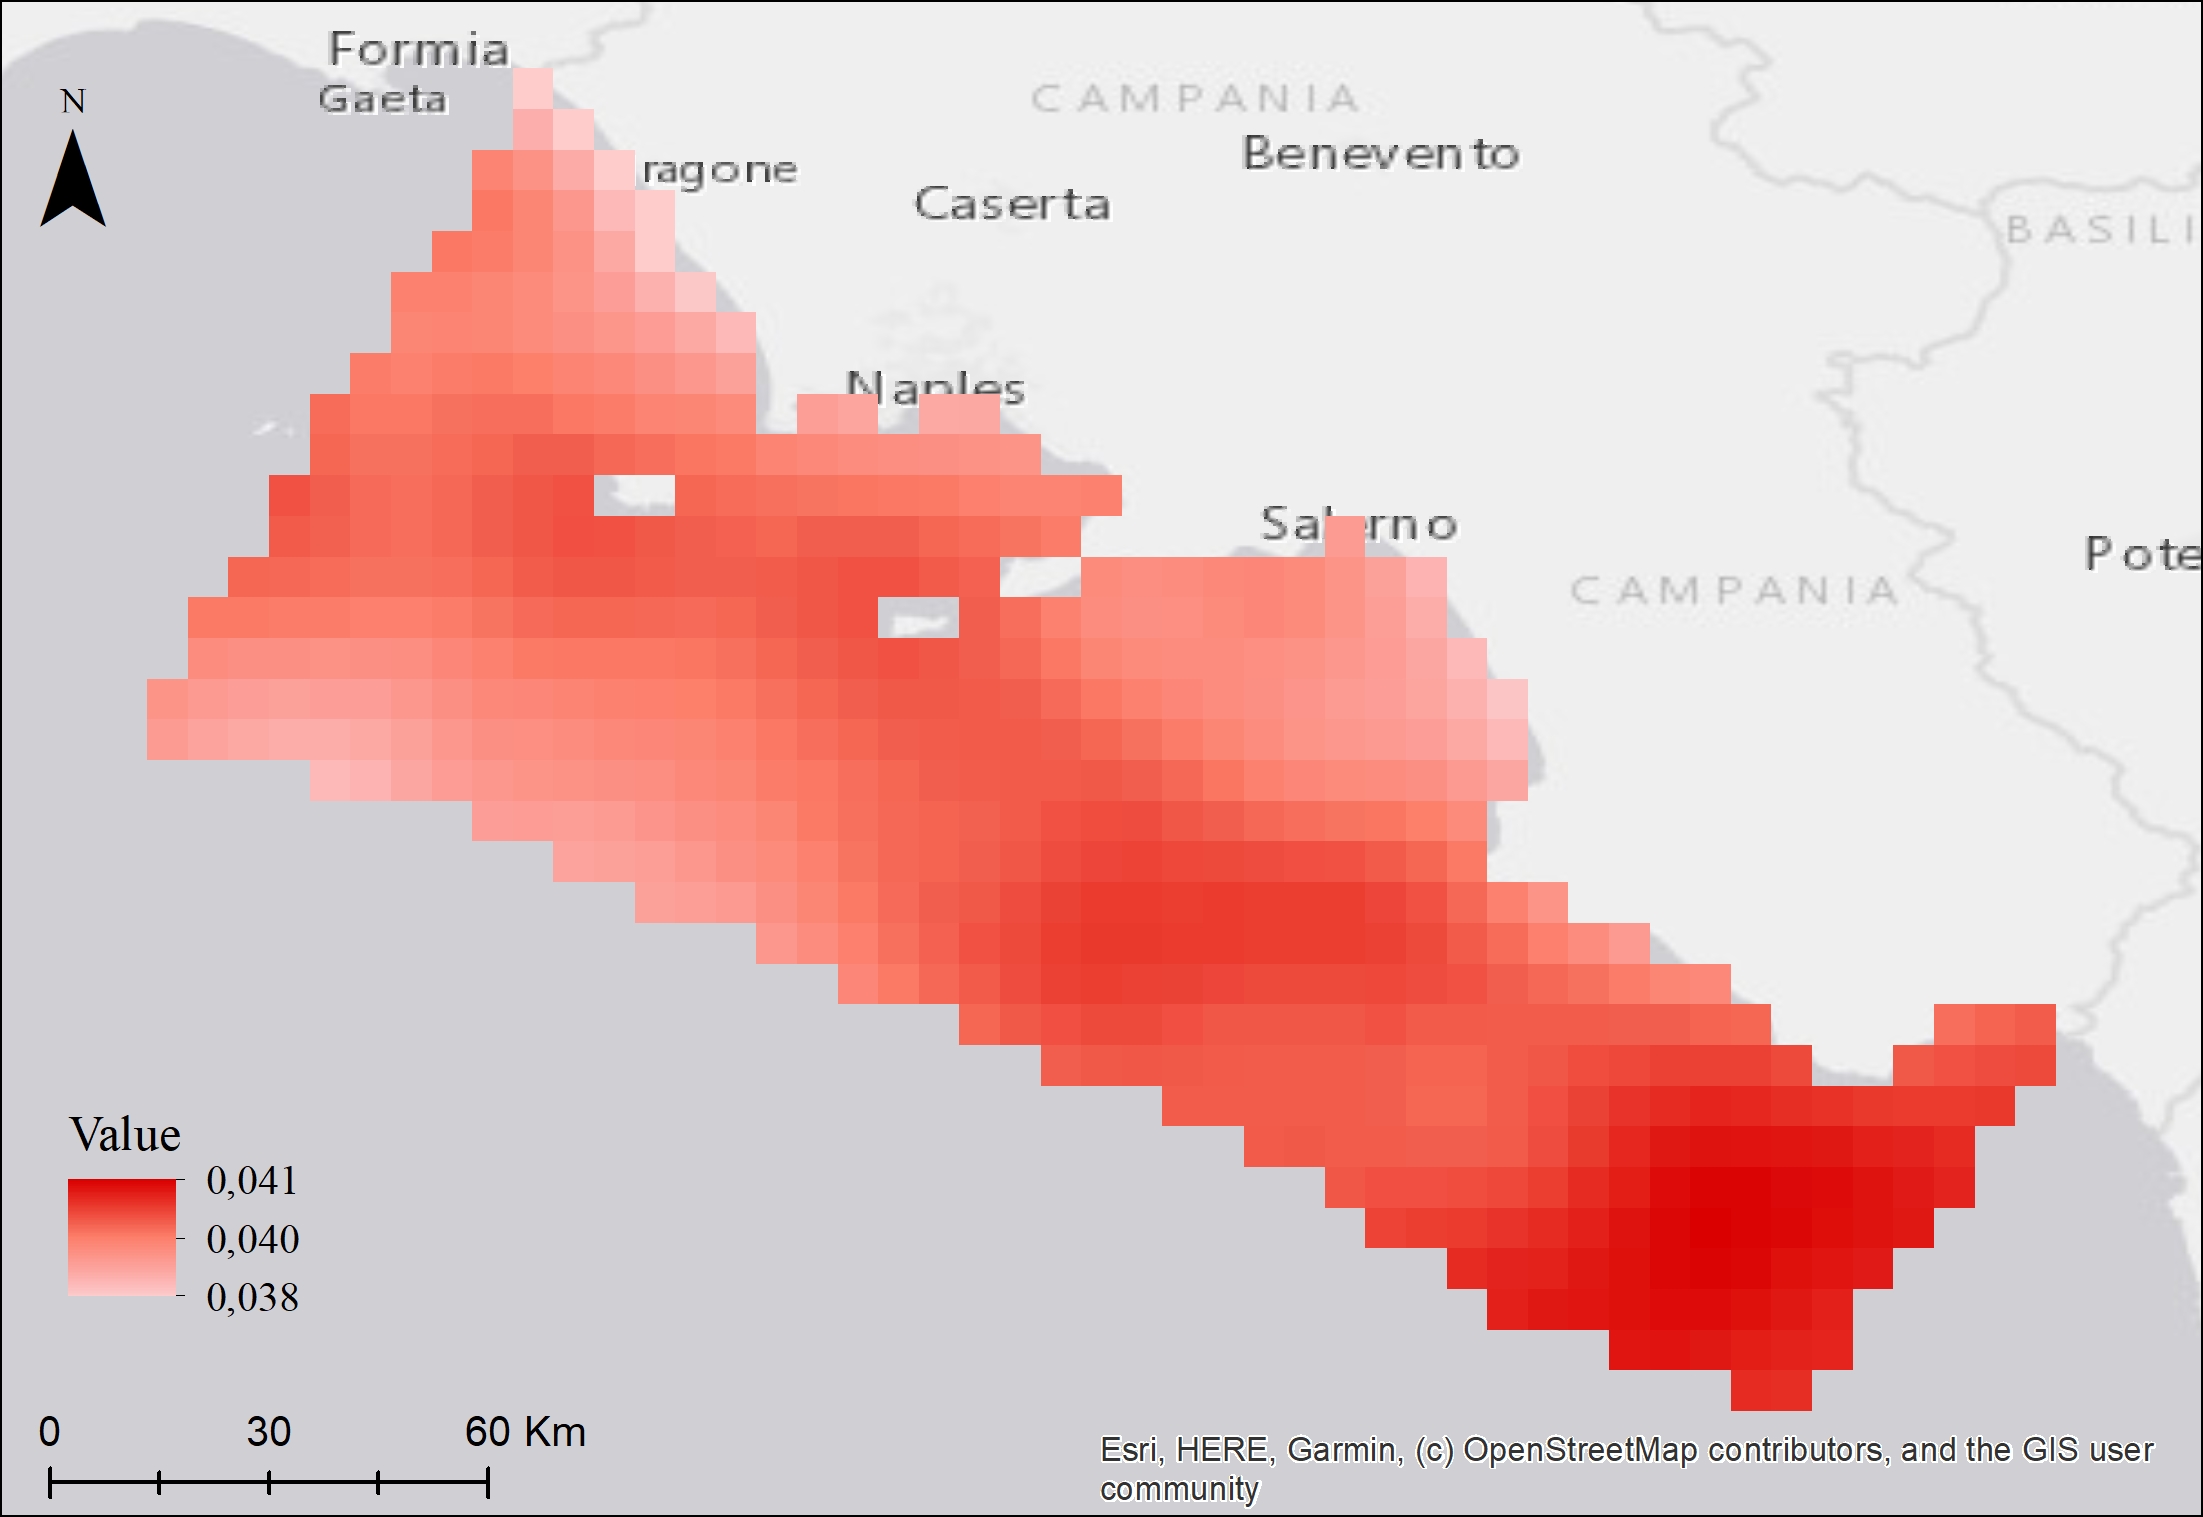
The superficial sea temperature (SST) map package was built with daily-mean data remotely collected. The package contains mean, max, min SST maps at high resolution (~1km) collected during 2020. The maps were also built over the four quarters of the year. These layers are provided with the suffixes Q1 to Q4.
-

The superficial sea temperature (SST) map package was built with daily-mean data at high spatial resolution (0.01 degree) remotely collected between 2008 and 2020. The maps were also built over the four quarters of the time period. These layers are provided with the suffixes Q1 to Q4. The SST trend maps show the increasing or decreasing trend of SST over the selected time period.
-

The superficial sea temperature (SST) map package was built with daily-mean data at low spatial resolution (0.05 degree) remotely collected between 1982 and 2020. The maps were also built over the four quarters of the time period. These layers are provided with the suffixes Q1 to Q4. The SST trend maps show the increasing or decreasing trend of SST over the selected time period.
 FEAMP GeoNetwork catalogue