oceans
Type of resources
Topics
INSPIRE themes
Keywords
Contact for the resource
Provided by
Years
Formats
Representation types
Update frequencies
status
Resolution
-

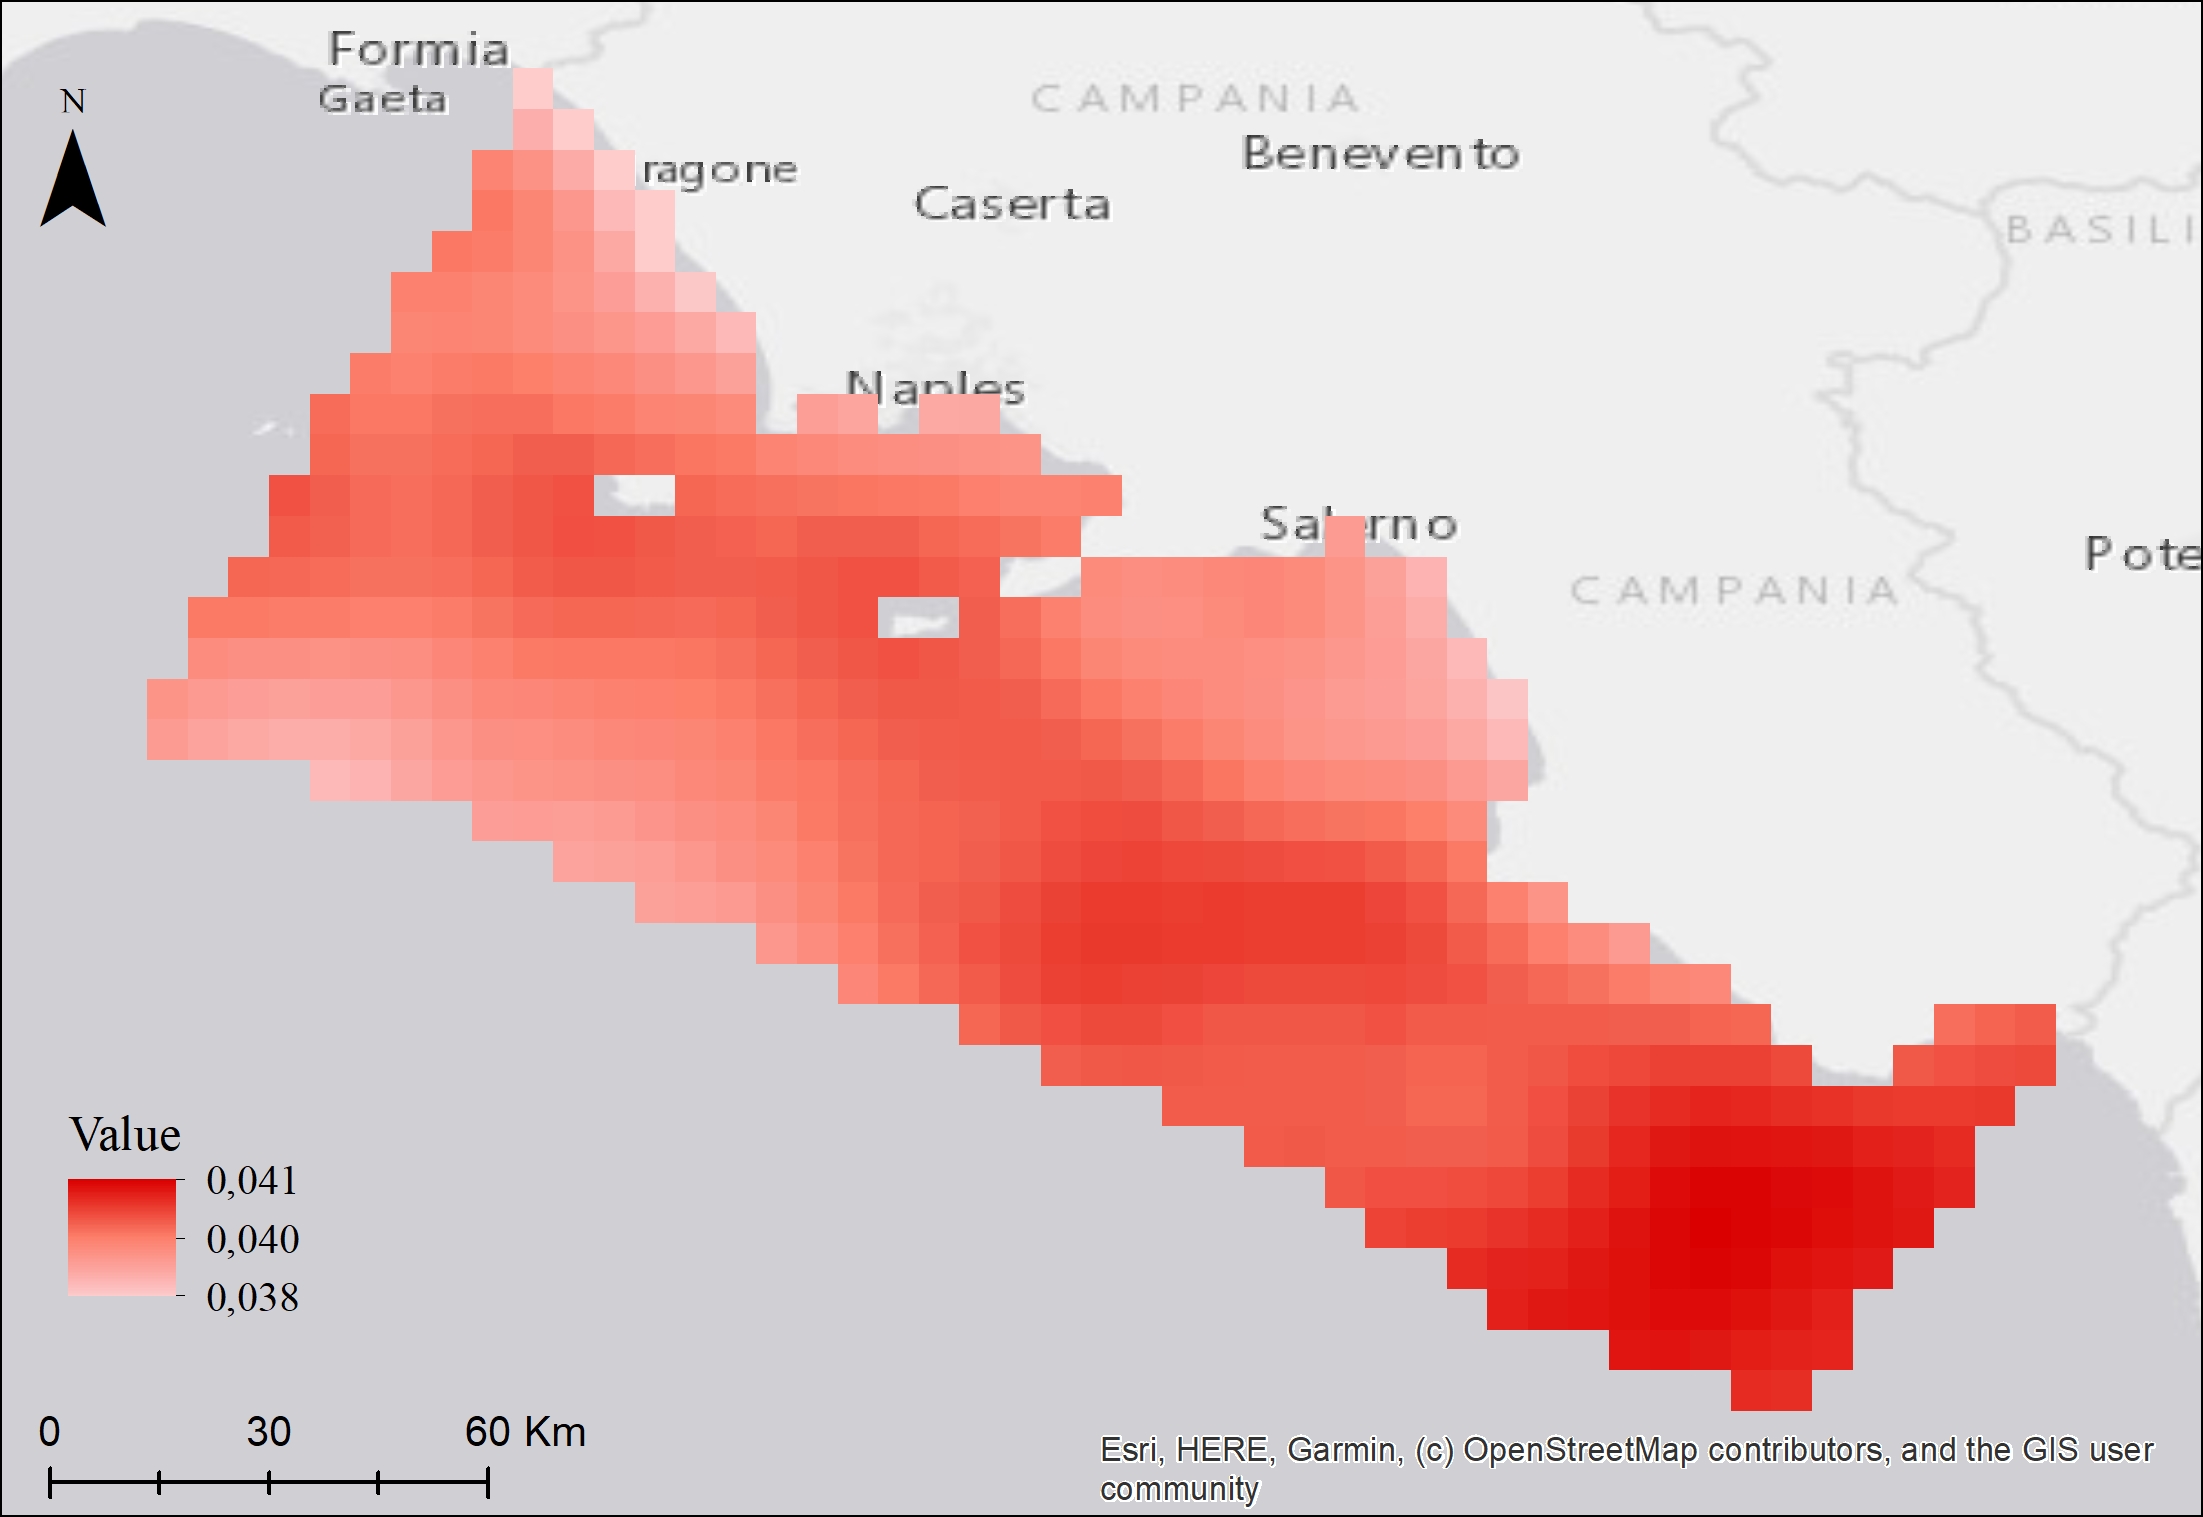
The superficial sea temperature (SST) map package was built with daily-mean data remotely collected. The package contains mean, max, min SST maps at high resolution (~1km) collected during 2020. The maps were also built over the four quarters of the year. These layers are provided with the suffixes Q1 to Q4.
-

The superficial sea temperature (SST) map package was built with daily-mean data at low spatial resolution (0.05 degree) remotely collected between 1982 and 2020. The maps were also built over the four quarters of the time period. These layers are provided with the suffixes Q1 to Q4. The SST trend maps show the increasing or decreasing trend of SST over the selected time period.
-

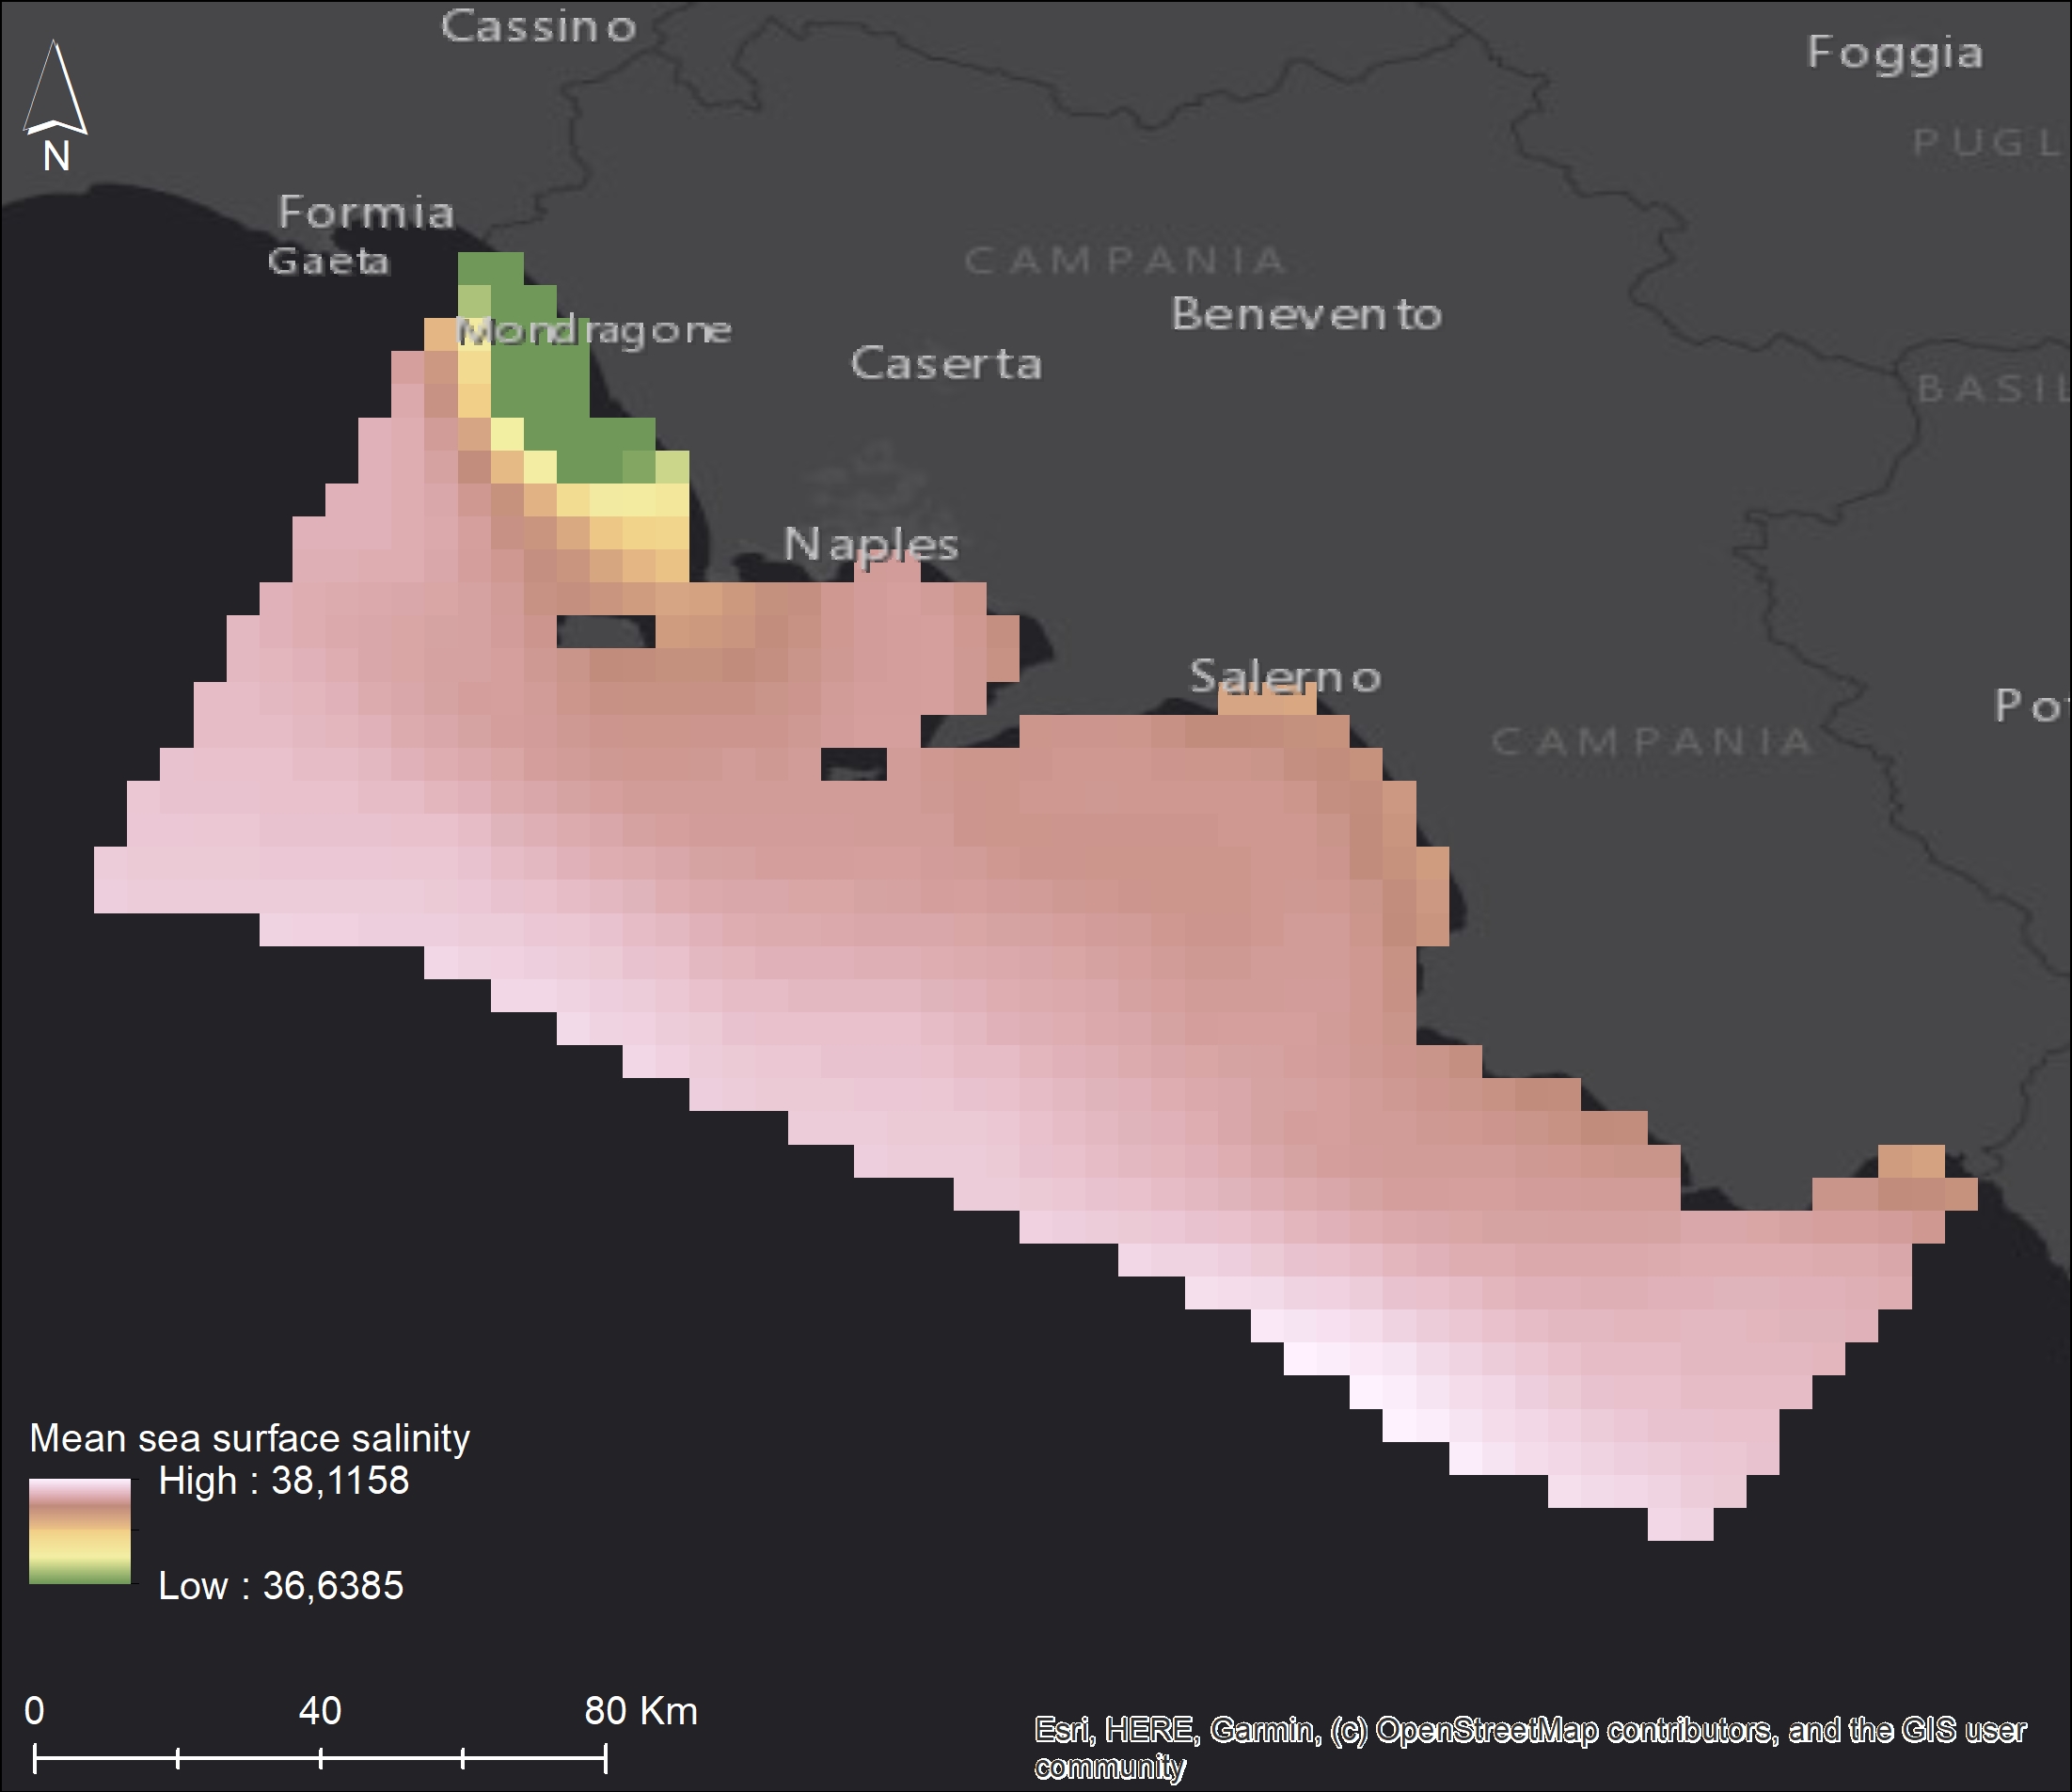
The superficial sea salinity (SSS) map package was built with daily-mean data remotely collected. The package contains mean SSS maps at 0.046 degrees (~5km) spatial resolution collected during 2020. The maps were also built over the four quarters of the year. These layers are provided with the suffixes Q1 to Q4.
-

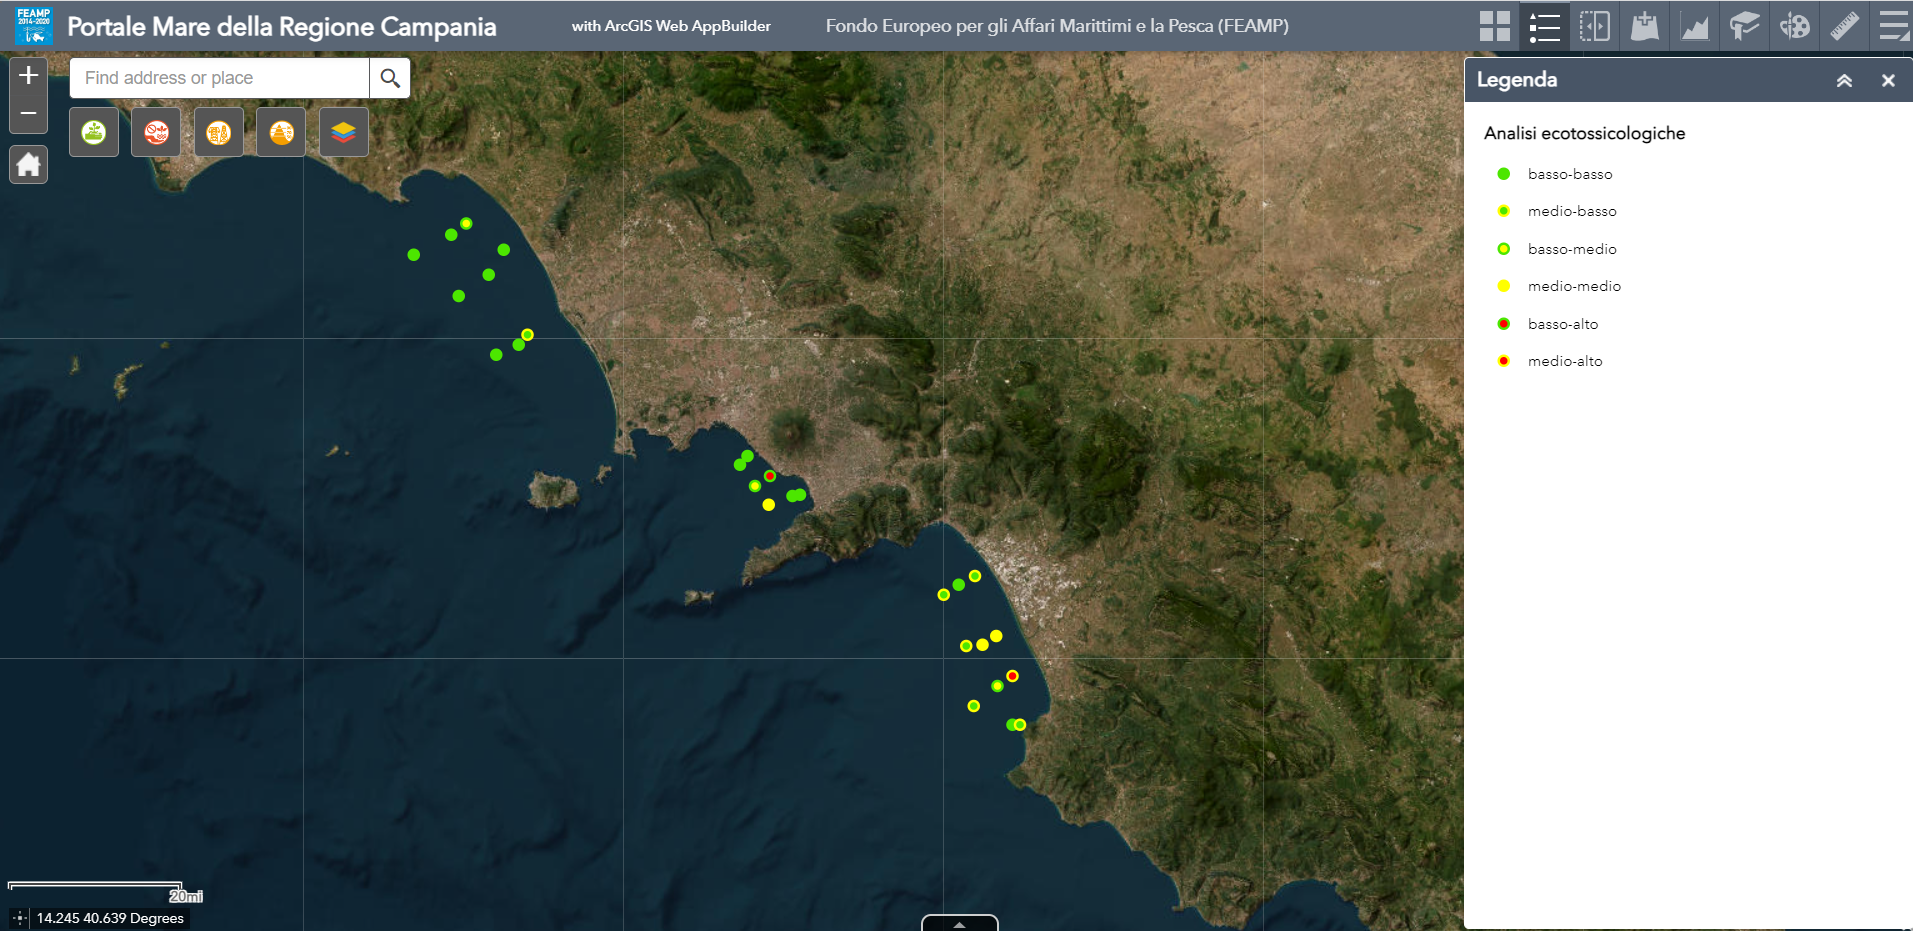
Definition of the chemical-physical quality status of designated areas and the associated ecological risk.
-

The layer shows the location of a total of 114 submerged or partially submerged archaeological sites have been identified. Most of the sites identified date from the Roman-Imperial period and the greatest concentration was found along the coast of the Municipality of Naples. Along the coast of Caserta there are only a few remains, while there are many testimonies along the coasts of the islands of Capri, Procida and Ischia and along the peninsulas of Sorrento and Cilento coast.
-

The bottom oxygen concentration (bottomO2) map package was built with monthly-mean data remotely collected. The package contains mean, max, min bottomO2 maps at low resolution (~5km) collected during 2019. The maps were also built over the four quarters of the year. These layers are provided with the suffixes Q1 to Q4.
-

The superficial oxygen concentration (O2) map package was built with monthly-mean data remotely collected. The package contains mean, max, min O2 maps at low resolution (~5km) collected during 2019. The maps were also built over the four quarters of the year. These layers are provided with the suffixes Q1 to Q4.
-
Dataset MSFD - Coralligenous habitat, Maerl, Pinna nobilis
-

Continental shelf corresponding to 200 meters below sea level generated from the EMODnet DTM
-

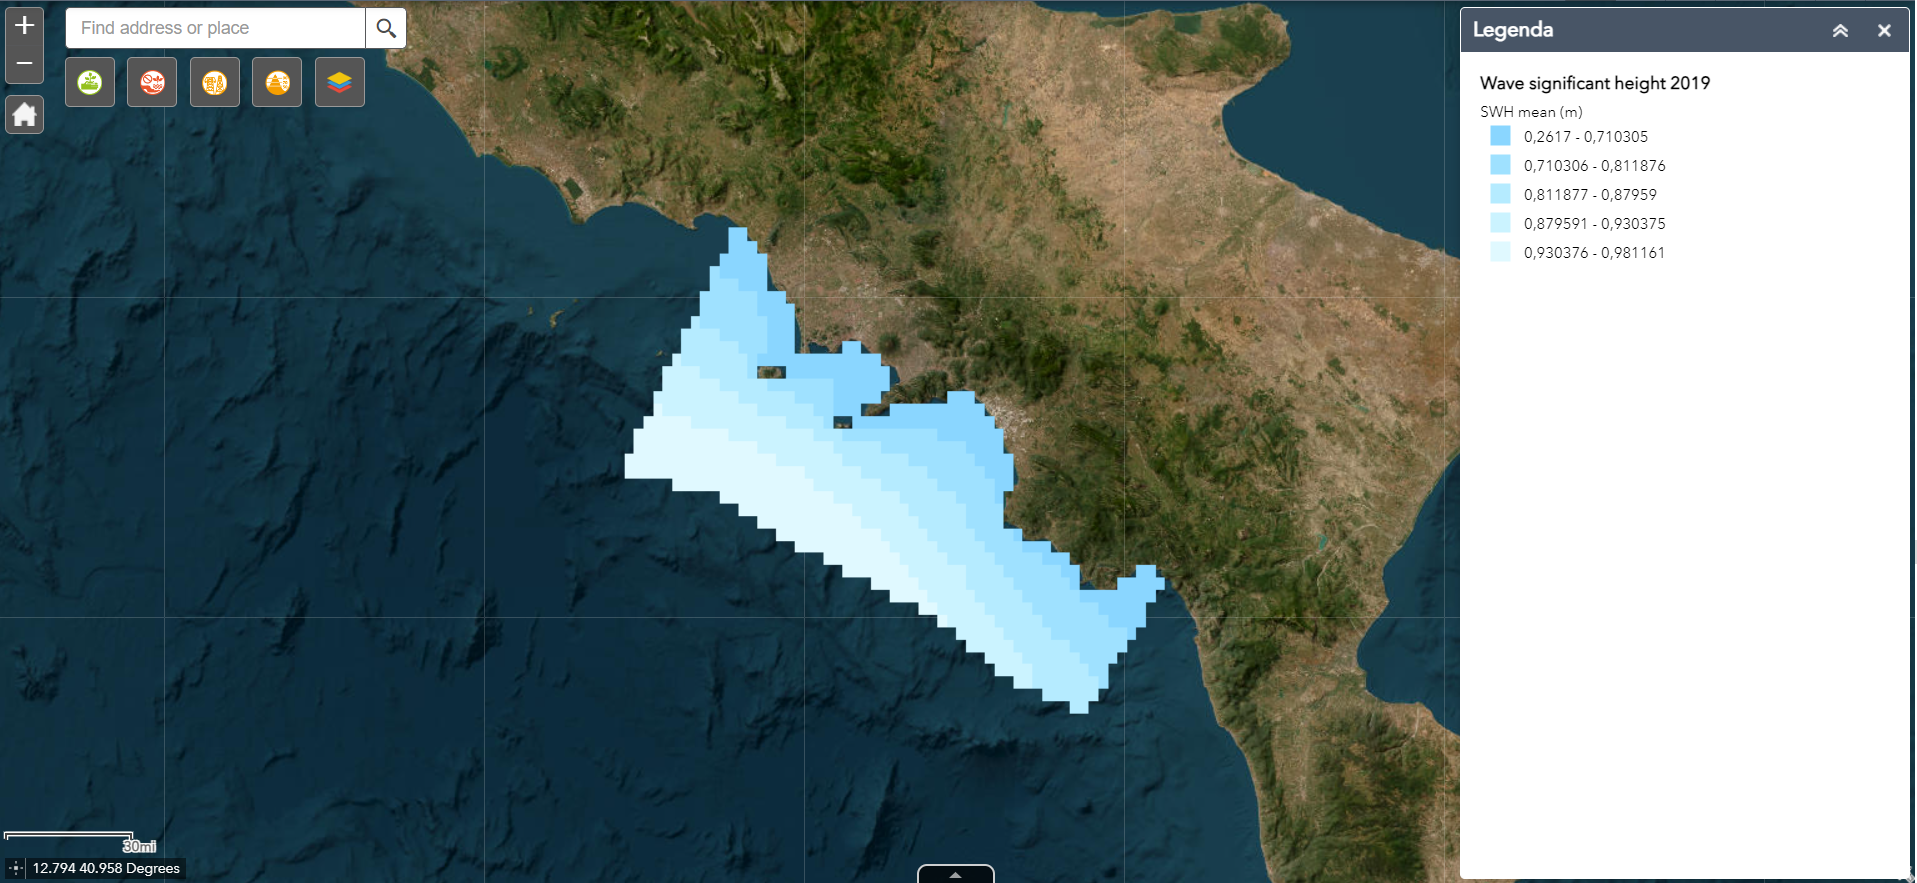
The wave significant height (VHM0) map package was built with daily-mean data remotely collected. The package contains mean, max, min VHM0 maps at low resolution (~5km) collected during 2019. The maps were also built over the four quarters of the year. These layers are provided with the suffixes Q1 to Q4.
 FEAMP GeoNetwork catalogue