Economy
Type of resources
Topics
INSPIRE themes
Keywords
Contact for the resource
Provided by
Years
Formats
Representation types
Update frequencies
status
-

Campania fishing fleet per port. Data were retrieved from the European fleet register and divided in classes of ages, power, gross tonnage and main fishing gear.
-

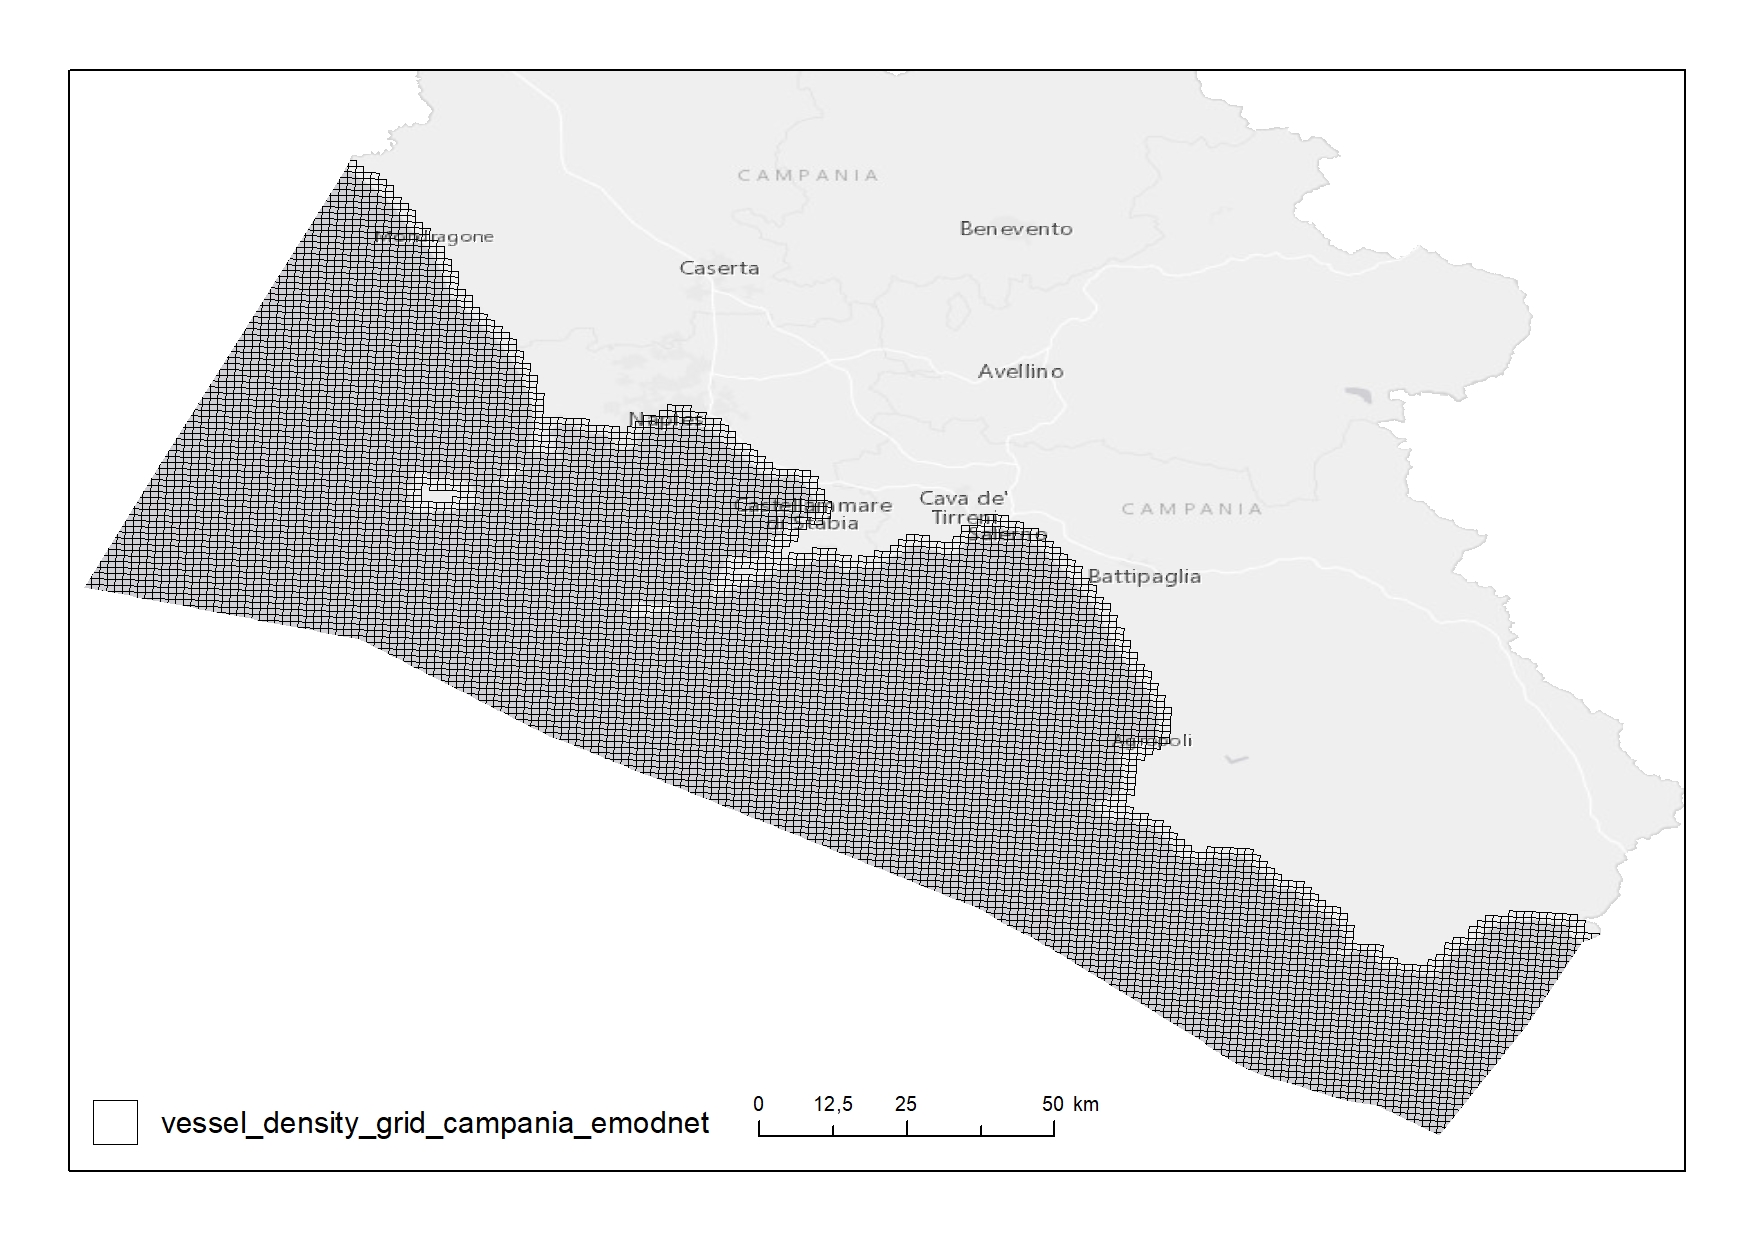
EMODnet Vessel Density maps were created by Cogea in 2019 in the framework of EMODnet Human Activities, an initiative funded by the EU Commission. The maps are based on AIS data purchased by Collecte Localisation Satellites (CLS) and ORBCOMM. The maps show shipping density in 1km*1km cells of a grid covering all EU waters (and some neighbouring areas). Density is expressed as hours per square kilometre per month. The following ship types are available:0 Other, 1 Fishing, 2 Service, 3 Dredging or underwater ops, 4 Sailing, 5 Pleasure Craft, 6 High speed craft, 7 Tug and towing, 8 Passenger, 9 Cargo, 10 Tanker, 11 Military and Law Enforcement, 12 Unknown and All ship types. Data are available by month of year. Yearly averages are also available
-

Points representing dredging sites in the Campania Region
-

Points of mooring or anchoring along the Campania coast
-

Bathing facilities on the coast of Campania Region
-

literature review digitalization
-

Monthly density of AIS signal (number of pings) and estimated fishing activities (in fishing hours) of bottom otter trawl (OTB) and purse seine (PS) from AIS 2019 in the study area - 1km grid resolution. All grid cells with estimated fishing effort less than 0.3 fishing hours were excluded.
-

Density of AIS signal (number of pings) and estimated fishing activities (in fishing hours) of bottom otter trawl (OTB) and purse seine (PS) from AIS 2019 in the study area. The estimation of fihsing effort include also fishing activity estimated by gaps analysis and by fleet segments - 1km grid resolution. All grid cells with estimated fishing effort less than 0.3 hours were excluded.
-

Shipping density from AIS data 2018 in 1km*1km cells of a grid covering the Campania Region. The following ship types are available:0 Other, 1 Fishing, 2 Service, 3 Dredging or underwater ops, 4 Sailing, 5 Pleasure Craft, 6 High speed craft, 7 Tug and towing, 8 Passenger, 9 Cargo, 10 Tanker, 11 Military and Law Enforcement, 12 Unknown and All ship types. Data are available by month of year. Yearly averages are also available.
-

Soil dumping sites and locations in the Campania Region
 FEAMP GeoNetwork catalogue