2021
Type of resources
Topics
INSPIRE themes
Keywords
Contact for the resource
Provided by
Years
Formats
Representation types
Update frequencies
status
Resolution
-

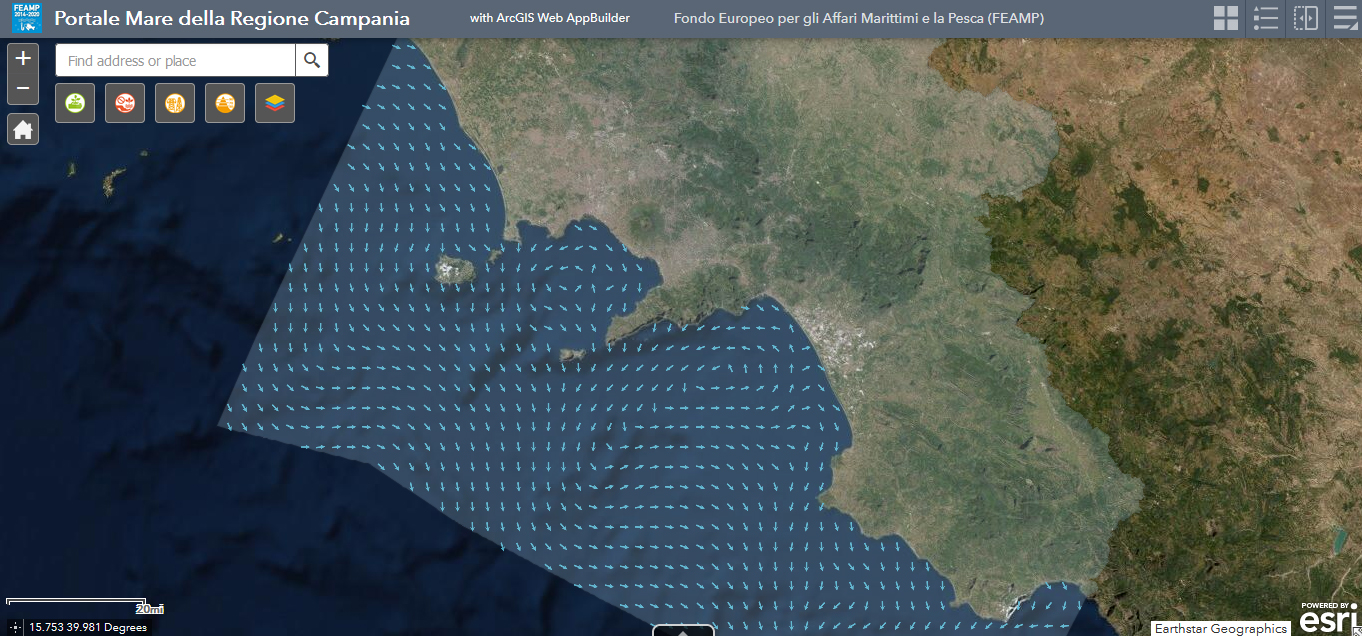
The physical component of the Mediterranean Forecasting System (Med-Currents) is a coupled hydrodynamic-wave model implemented over the whole Mediterranean Basin including tides. The model horizontal grid resolution is 1/24˚ (ca. 4 km) and has 141 unevenly spaced vertical levels.The hydrodynamics are supplied by the Nucleous for European Modelling of the Ocean (NEMO v3.6) while the wave component is provided by Wave Watch-III; the model solutions are corrected by a variational data assimilation scheme (3DVAR) of temperature and salinity vertical profiles and along track satellite Sea Level Anomaly observations. Product Citation: Please refer to our Technical FAQ for citing products.http://marine.copernicus.eu/faq/cite-cmems-products-cmems-credit/?idpage=169 REFERENCES https://doi.org/10.25423/CMCC/MEDSEA_ANALYSISFORECAST_PHY_006_013_EAS6 Clementi, E., Aydogdu, A., Goglio, A. C., Pistoia, J., Escudier, R., Drudi, M., Grandi, A., Mariani, A., Lyubartsev, V., Lecci, R., Cretí, S., Coppini, G., Masina, S., & Pinardi, N. (2021). Mediterranean Sea Physical Analysis and Forecast (CMEMS MED-Currents, EAS6 system) (Version 1) [Data set]. Copernicus Monitoring Environment Marine Service (CMEMS). Further details: https://resources.marine.copernicus.eu/?option=com_csw&view=details&product_id=MEDSEA_ANALYSISFORECAST_PHY_006_013
-
Chemical data
-

The physical component of the Mediterranean Forecasting System (Med-Currents) is a coupled hydrodynamic-wave model implemented over the whole Mediterranean Basin including tides. The model horizontal grid resolution is 1/24˚ (ca. 4 km) and has 141 unevenly spaced vertical levels.The hydrodynamics are supplied by the Nucleous for European Modelling of the Ocean (NEMO v3.6) while the wave component is provided by Wave Watch-III; the model solutions are corrected by a variational data assimilation scheme (3DVAR) of temperature and salinity vertical profiles and along track satellite Sea Level Anomaly observations. Product Citation: Please refer to our Technical FAQ for citing products.http://marine.copernicus.eu/faq/cite-cmems-products-cmems-credit/?idpage=169 REFERENCES https://doi.org/10.25423/CMCC/MEDSEA_ANALYSISFORECAST_PHY_006_013_EAS6 Clementi, E., Aydogdu, A., Goglio, A. C., Pistoia, J., Escudier, R., Drudi, M., Grandi, A., Mariani, A., Lyubartsev, V., Lecci, R., Cretí, S., Coppini, G., Masina, S., & Pinardi, N. (2021). Mediterranean Sea Physical Analysis and Forecast (CMEMS MED-Currents, EAS6 system) (Version 1) [Data set]. Copernicus Monitoring Environment Marine Service (CMEMS). Further details: https://resources.marine.copernicus.eu/?option=com_csw&view=details&product_id=MEDSEA_ANALYSISFORECAST_PHY_006_013
-

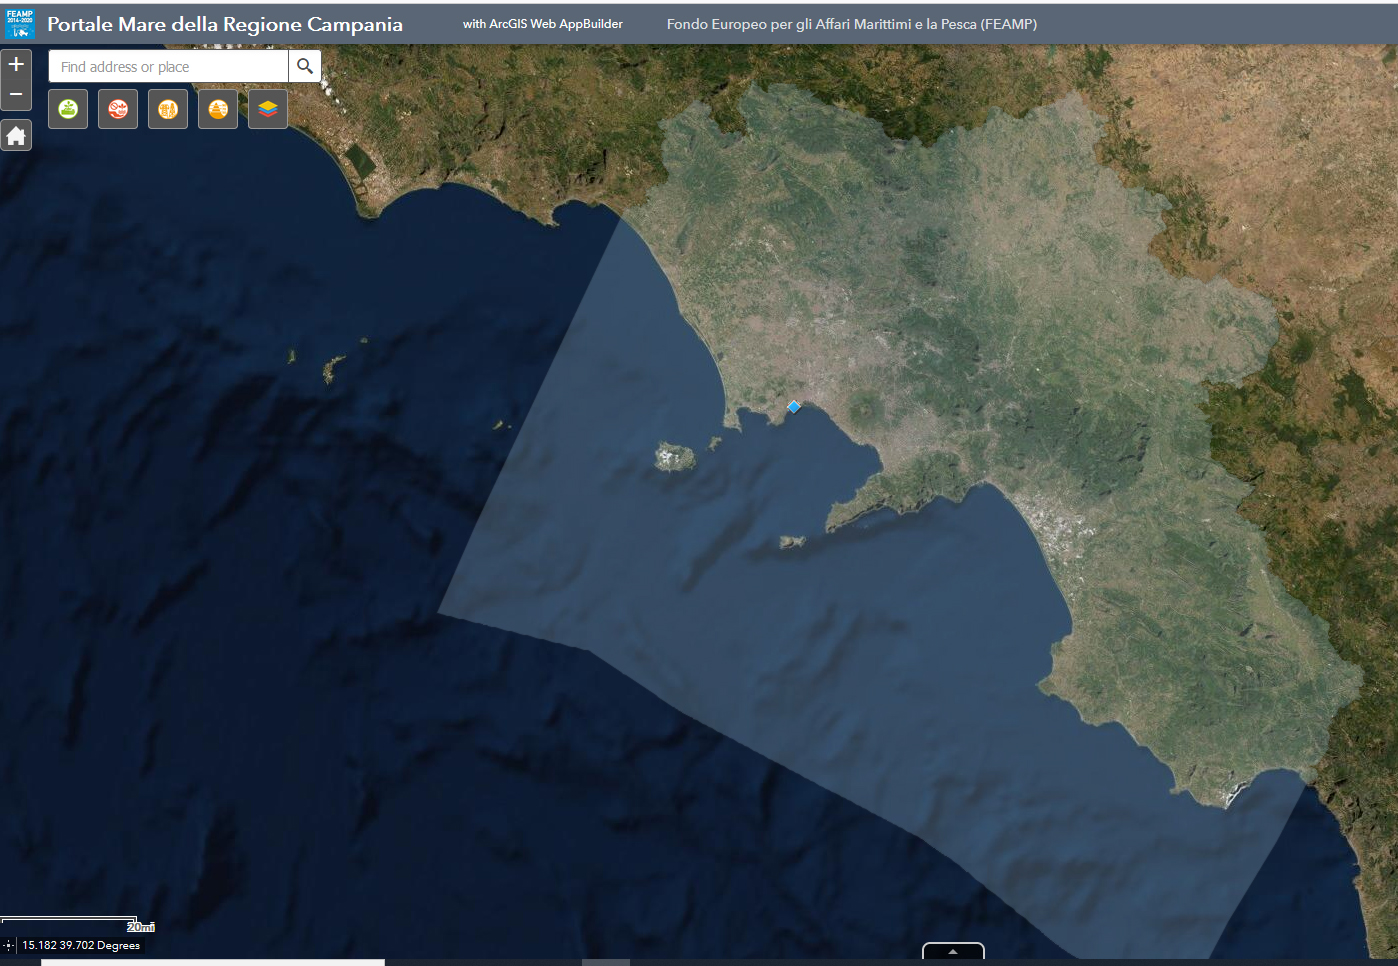
The weather station installed on MEDA_B located in the Gulf of Naples (Latitude: 40 ° 49.668 'N, Longitude: 014 ° 13.984' E), continuously sample each hour, the following parameters: Wind direction (degrees), Wind Speed (m / s), Air Temperature (° C), Atmospheric Pressure (hPa), Relative Humidity (%), Rain (mm / h) and Photosynthetically Active Radiation (PAR, µE / m2 × sec).
-

Potential distribution of Hippocampus hippocampus in the FEAMP area. We used an ecological modelling approach by using Biomod2 package in R. Spatial resolution 1 km2. For further details see: https://onlinelibrary.wiley.com/doi/full/10.1111/ddi.12741
-

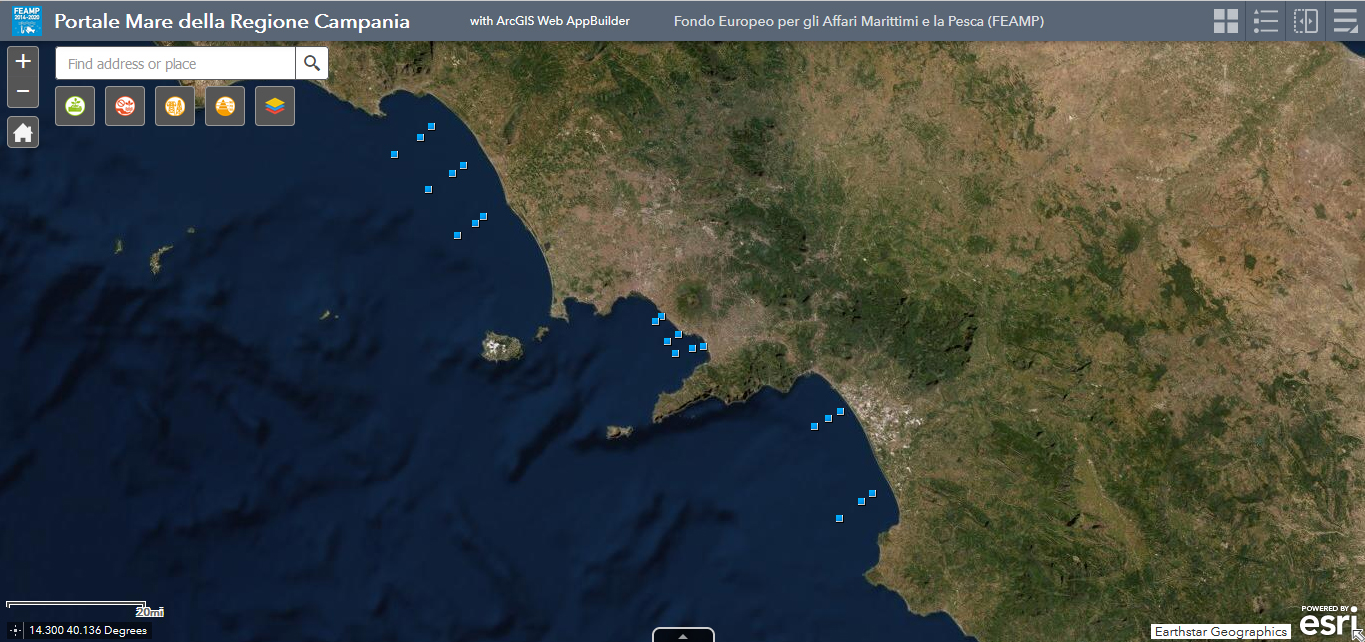
Physical parameters collected during the FEAMP oceanographic campaign, in the Gulf of Gaeta (09 and 10 September 2020), Gulf of Naples (17 and 18 September 2020) and Gulf of Salerno (06 and 09 October 2020). The sampling parameters are temperature (Tv290C), conductivity (C0mS/cm), salinity (Sal00), density (Sigma-é00), oxygen (Sbeox0PS; Sbeox0ML/L), ph, transmittance (CStarTr0; CStarAt0), turbidity (TurbflTC0) and fluorescence (FlECO-AFL). The parameters are collected over the entire water column.
-

Campania UNESCO World Heritage Sites downloaded from the websites of the Ministery of Cultural Heritage.
-
Wave data, collected by ADCP current meter installed in the Gulf of Naples (Latitude: 40 ° 49.668 'N, Longitude: 014 ° 13.984' E), on a depth of 17.5 m. Data are sampled continuously, every 15 minutes. The parameters acquired are wave height (m), wave period (s), wave direction (degrees) and tide (m).
-

The physical component of the Mediterranean Forecasting System (Med-Currents) is a coupled hydrodynamic-wave model implemented over the whole Mediterranean Basin including tides. The model horizontal grid resolution is 1/24˚ (ca. 4 km) and has 141 unevenly spaced vertical levels.The hydrodynamics are supplied by the Nucleous for European Modelling of the Ocean (NEMO v3.6) while the wave component is provided by Wave Watch-III; the model solutions are corrected by a variational data assimilation scheme (3DVAR) of temperature and salinity vertical profiles and along track satellite Sea Level Anomaly observations. Product Citation: Please refer to our Technical FAQ for citing products.http://marine.copernicus.eu/faq/cite-cmems-products-cmems-credit/?idpage=169 REFERENCES https://doi.org/10.25423/CMCC/MEDSEA_ANALYSISFORECAST_PHY_006_013_EAS6 Clementi, E., Aydogdu, A., Goglio, A. C., Pistoia, J., Escudier, R., Drudi, M., Grandi, A., Mariani, A., Lyubartsev, V., Lecci, R., Cretí, S., Coppini, G., Masina, S., & Pinardi, N. (2021). Mediterranean Sea Physical Analysis and Forecast (CMEMS MED-Currents, EAS6 system) (Version 1) [Data set]. Copernicus Monitoring Environment Marine Service (CMEMS). Further details: https://resources.marine.copernicus.eu/?option=com_csw&view=details&product_id=MEDSEA_ANALYSISFORECAST_PHY_006_013
-

Adult females of Temora stylifera and Acartia clausi, sorted from the mesozooplankton sample, incubated for 24h in natural surface seawater collected at the same sampling station, to assess fecal pellet production (pellets/female/day) and egg production (eggs/female/day). After 48h, calculated the hatching success of these eggs (% hatching success). Individual parameters converted into population parameters in situ, taking into account female abundance at the same station and defined as egg/m3 and nauplii/m3. The file ‘produzione copepodi_tutti’, contains mean and SD of the above parameters, for each of the sampled copepod species.
 FEAMP GeoNetwork catalogue